Quickstart Tour
Apache StreamPipes is a self-service Industrial IoT toolbox to enable non-technical users to connect, analyze and explore IoT data streams.
Quickstart Mode, ideal for first-time users, allows users to interact with pre-set pipelines, dashboards, and data views to experience StreamPipes' functionalities for IIoT. This page provides an overview of StreamPipes' features in Quickstart Mode, guiding users on how to utilize them effectively.
Do you have StreamPipes already running in the quickstart mode? If not, simply run the command docker-compose -f docker-compose.quickstart.yml build script-runner and docker-compose -f docker-compose.quickstart.yml up -d from the directory installer/compose.
First of all, a user needs to log in to the system. The default login credentials are admin@streampipes.apache.org as username and admin as password.
The credentials for the user are specified during the installation process.
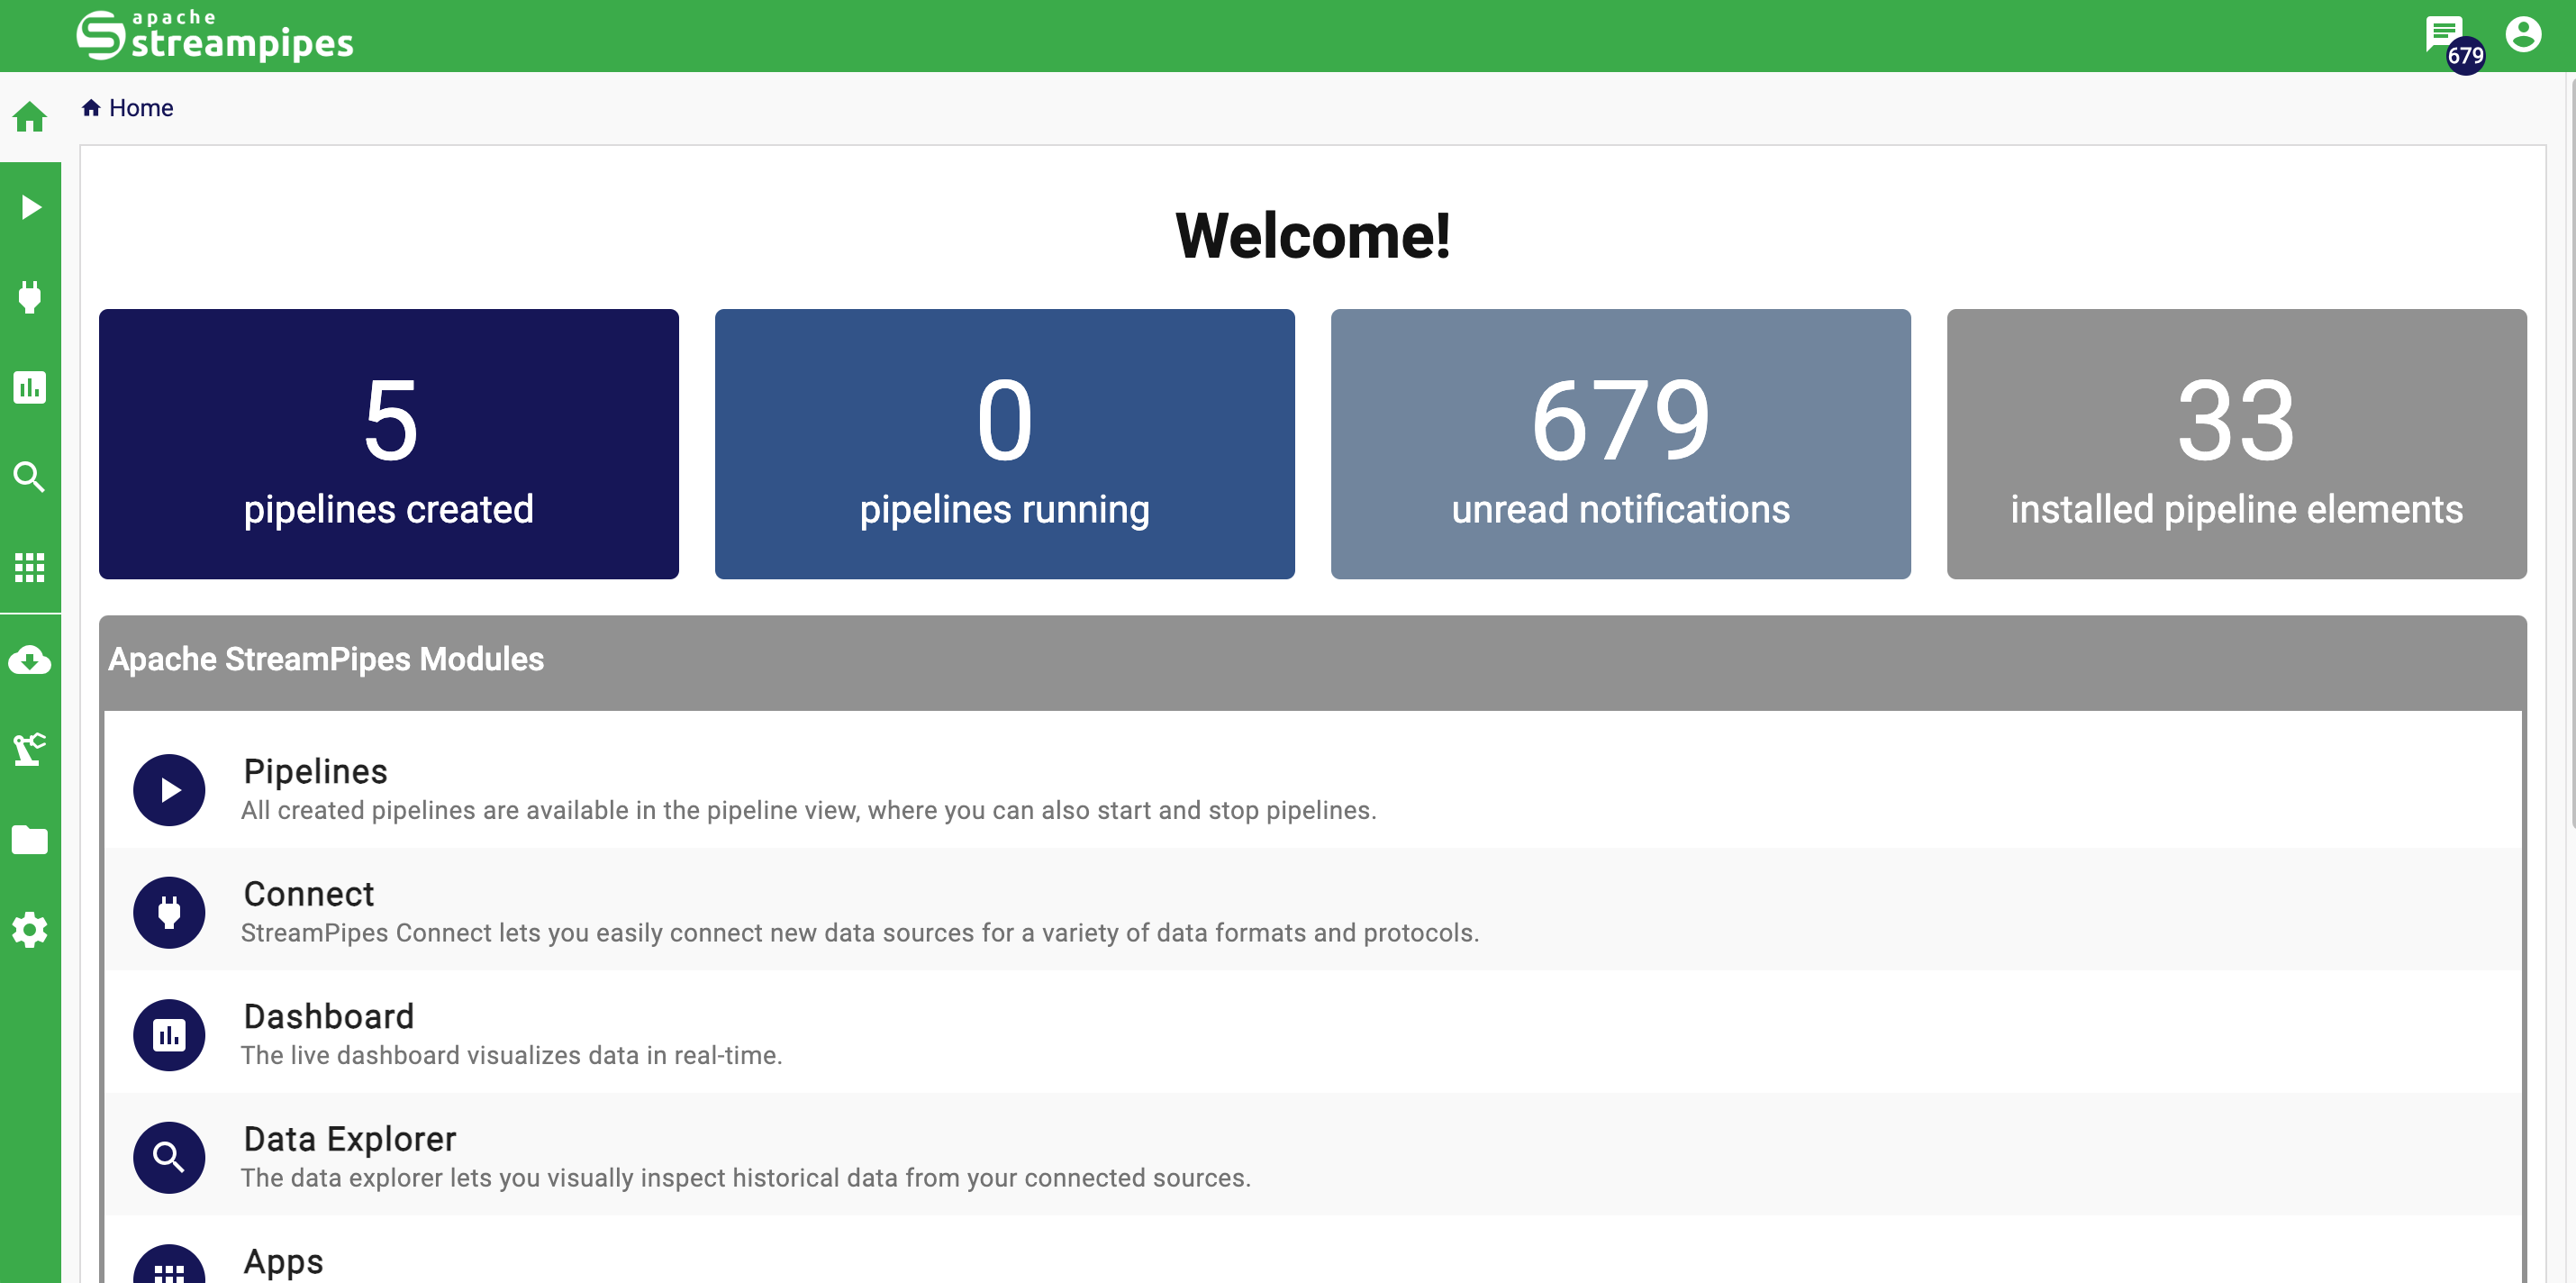
Home
After logging in, the user is redirected on to the home page. The home page gives an overview over the different features available in the StreamPipes UI.
On the left, the navigation menu can be seen. You can either use the icons on the left side or click on the menu icon on the top left to open the details view of the navigation menu.
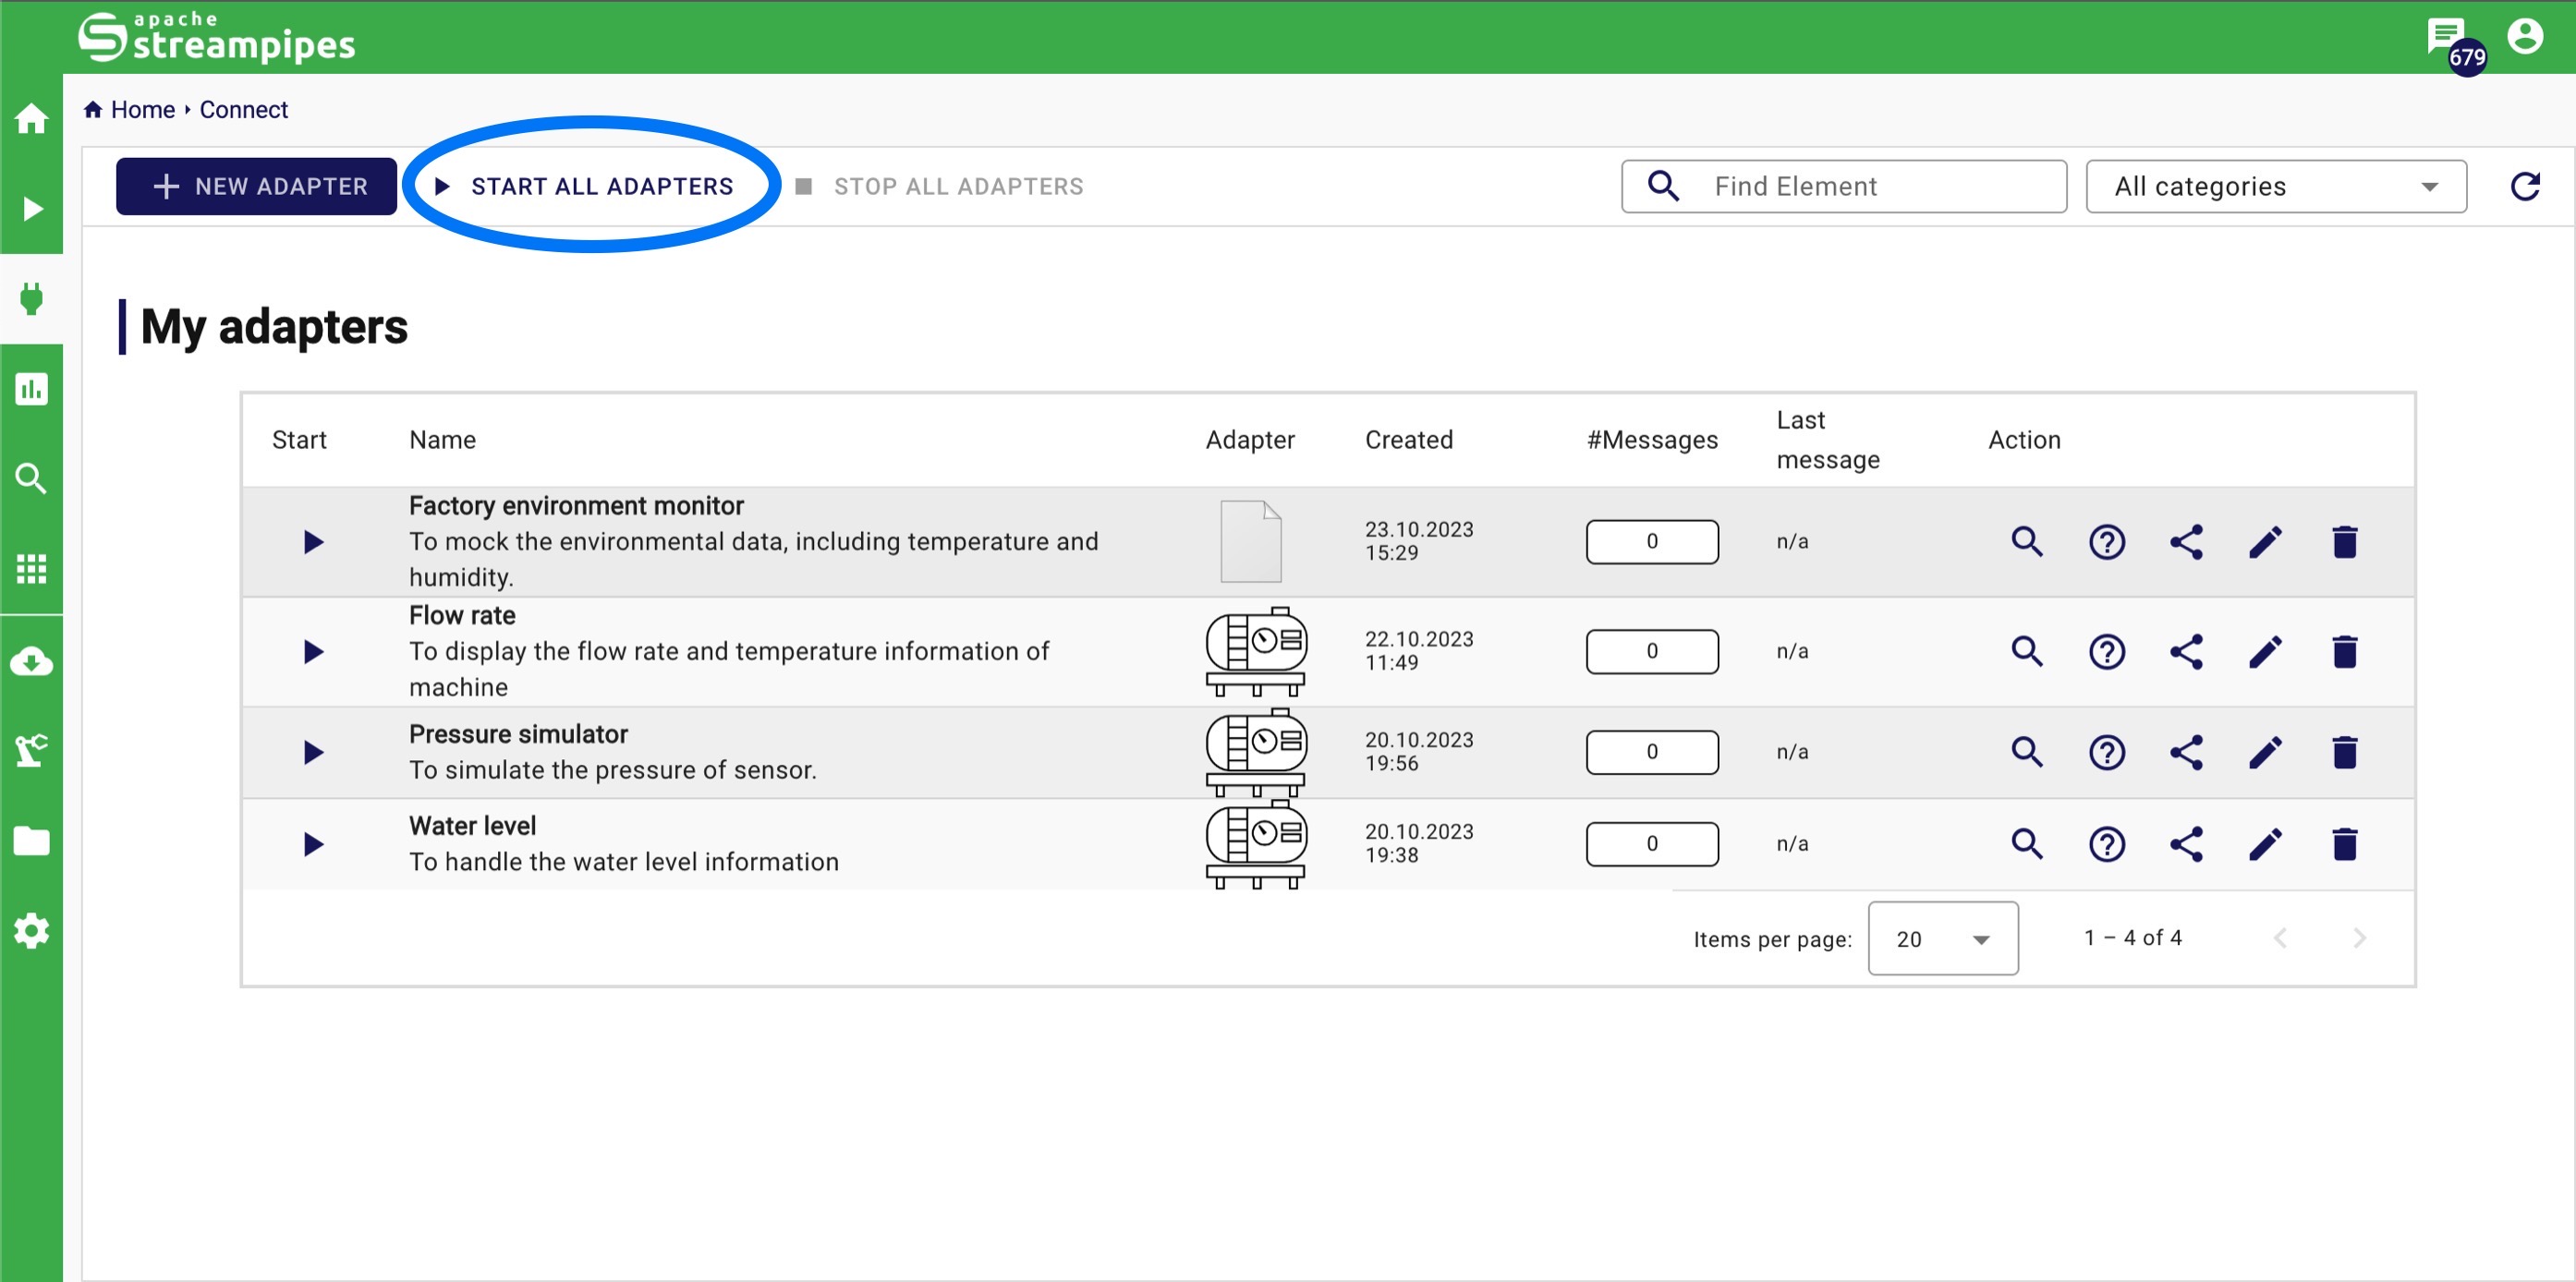
Connect
The Connect view provides an overview of all existing adapters to let StreamPipes connect data sources.
With StreamPipes Connect it is possible to connect new data sources in StreamPipes with just a few clicks. It is also possible to connect specific data sources or connect generic sources like message brokers or databases. If the event schema of the data source is unknown, the system tries to infer the schema by extracting some sample data and analysing it.
In the Quickstart Mode, we use the Machine Data Simulator and Data Stream to simulate the factory machine condition data and environmental data, just click the START ALL ADAPTERS button. This starts all existing adapters to offer data sources for pipelines.
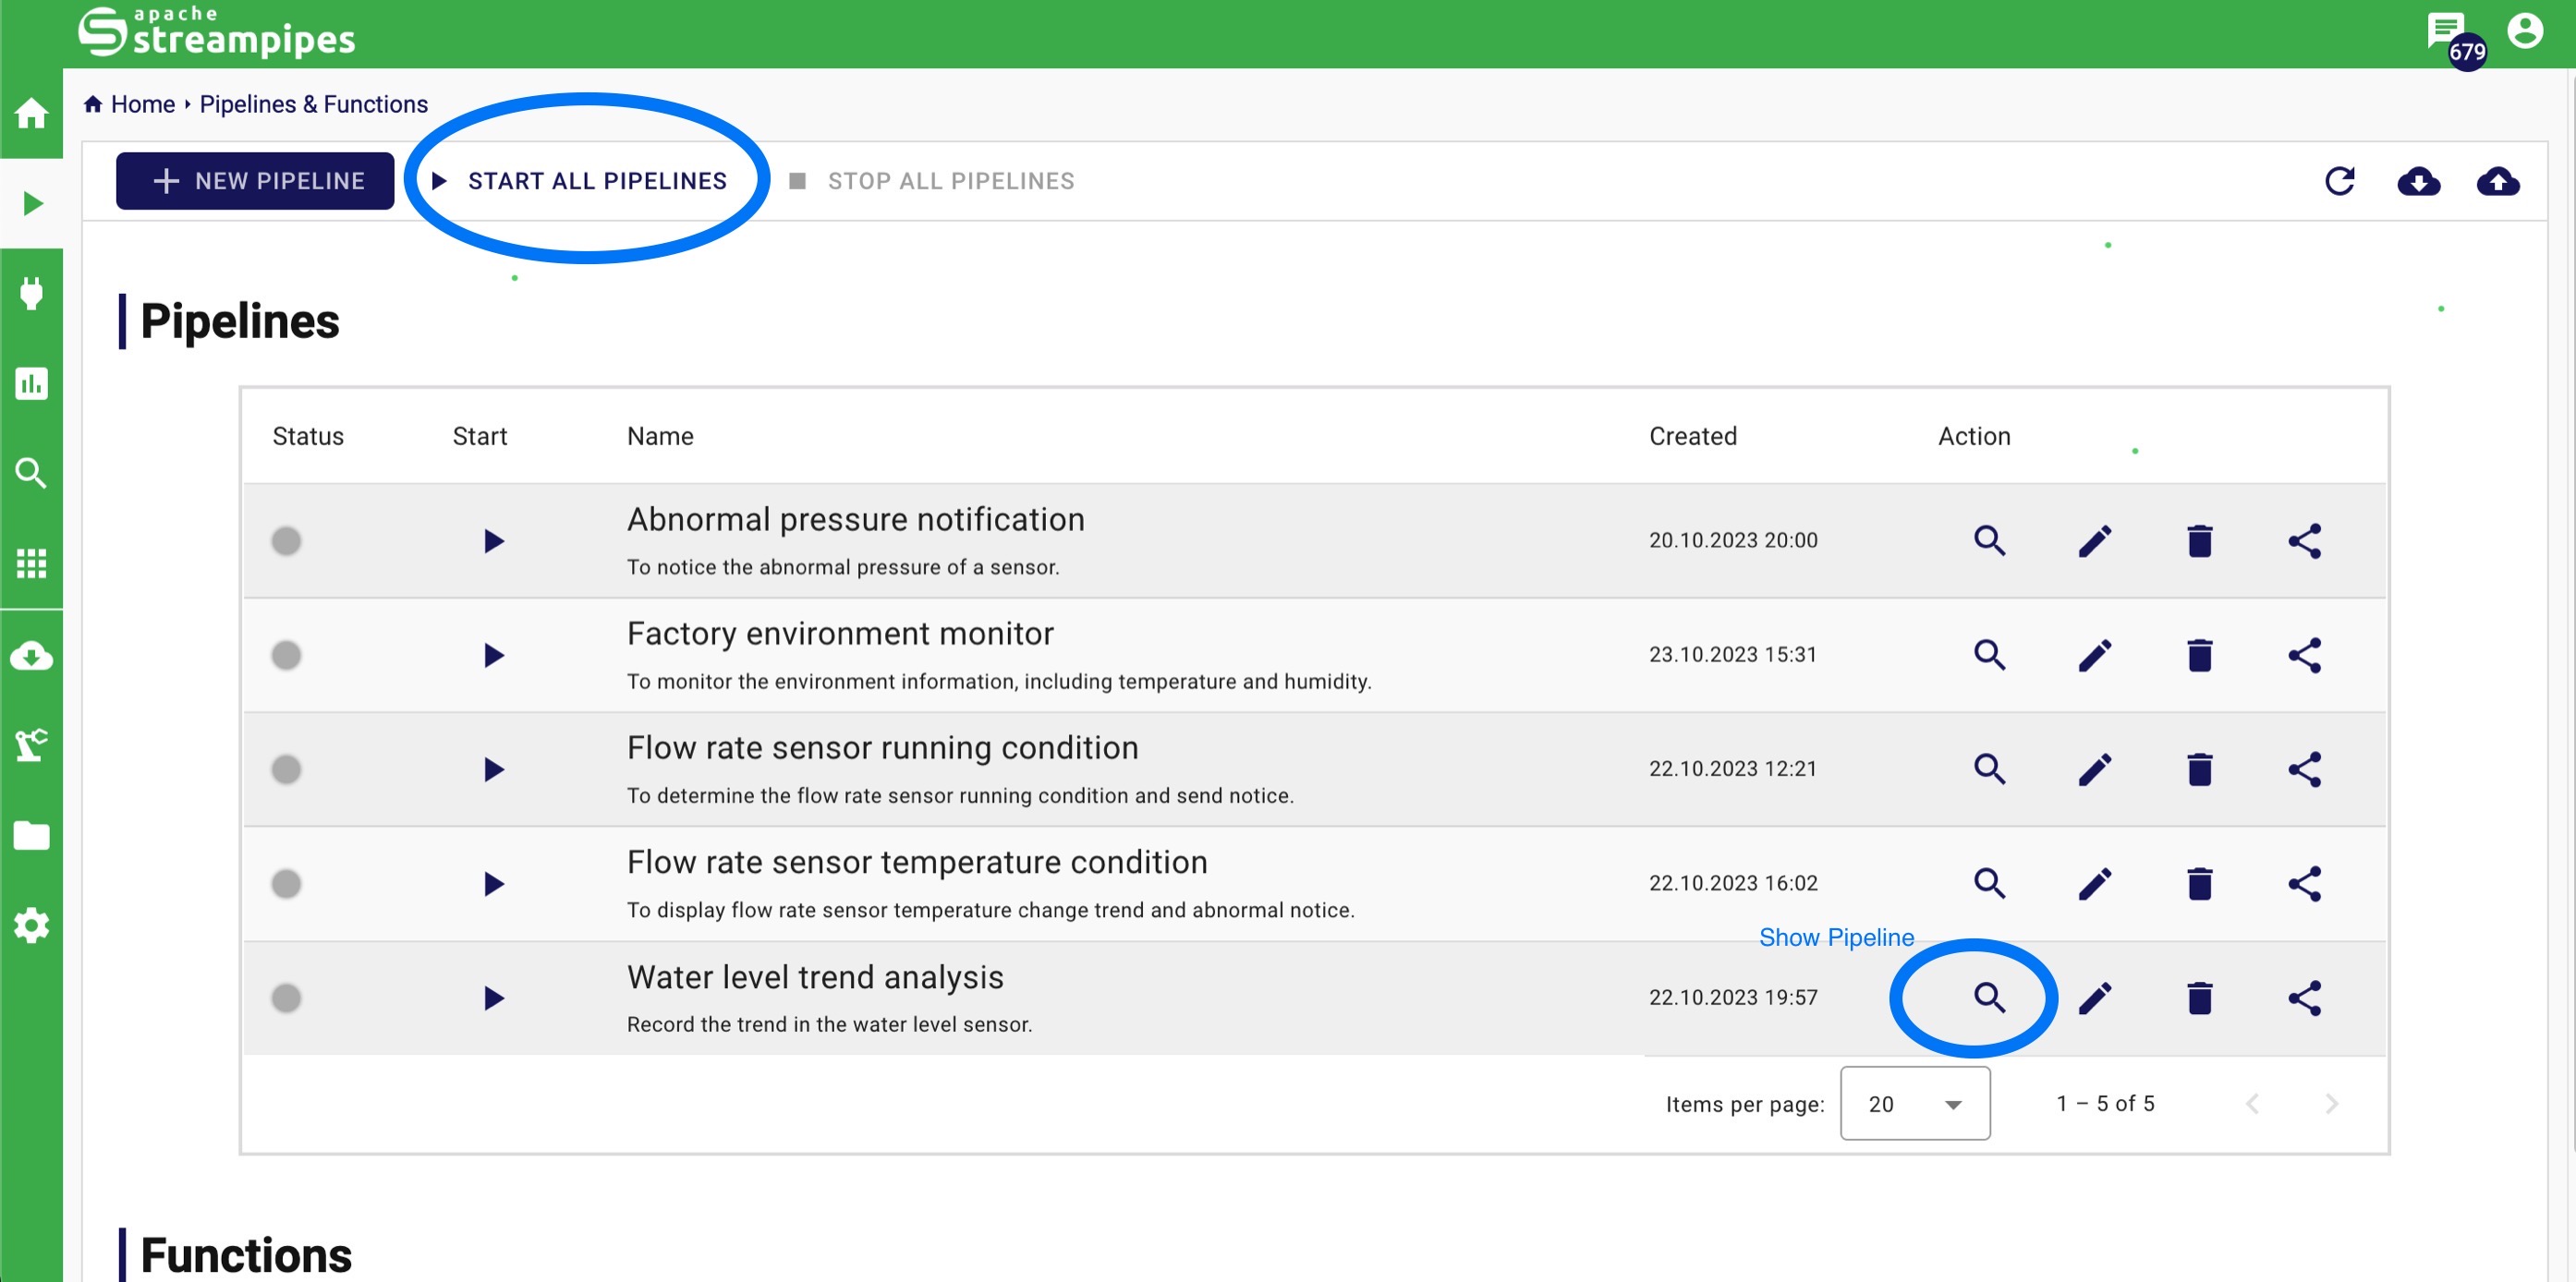
Pipelines
The Pipelines view provides an overview of all existing pipelines.
A pipeline in Apache StreamPipes describes the transformation process from a data stream to a data sink. Typically, a pipeline consists of at least one data stream (or data set), zero or more data processors and at least one data sink. Existing pipelines can be managed using this pipeline view. For instance, users can start and stop pipelines or delete them when they are not longer needed.
In the pipeline page, we could see there are 5 pipelines, click the START ALL ADAPTERS button. This starts all existing adapters to offer data sources for pipelines.
In smart factory , monitoring and analysing machine parameters are essential steps to ensure machine safety, and minimizing downtime. In the industrial machine cooling system or hydraulic machines, water level could be an important part of monitoring parameters to ensure machine's performance and safety.
Using the Water level trend analysis pipeline as an example, by clicking the Show pipeline button, we could see the details of the pipeline as the following figure.
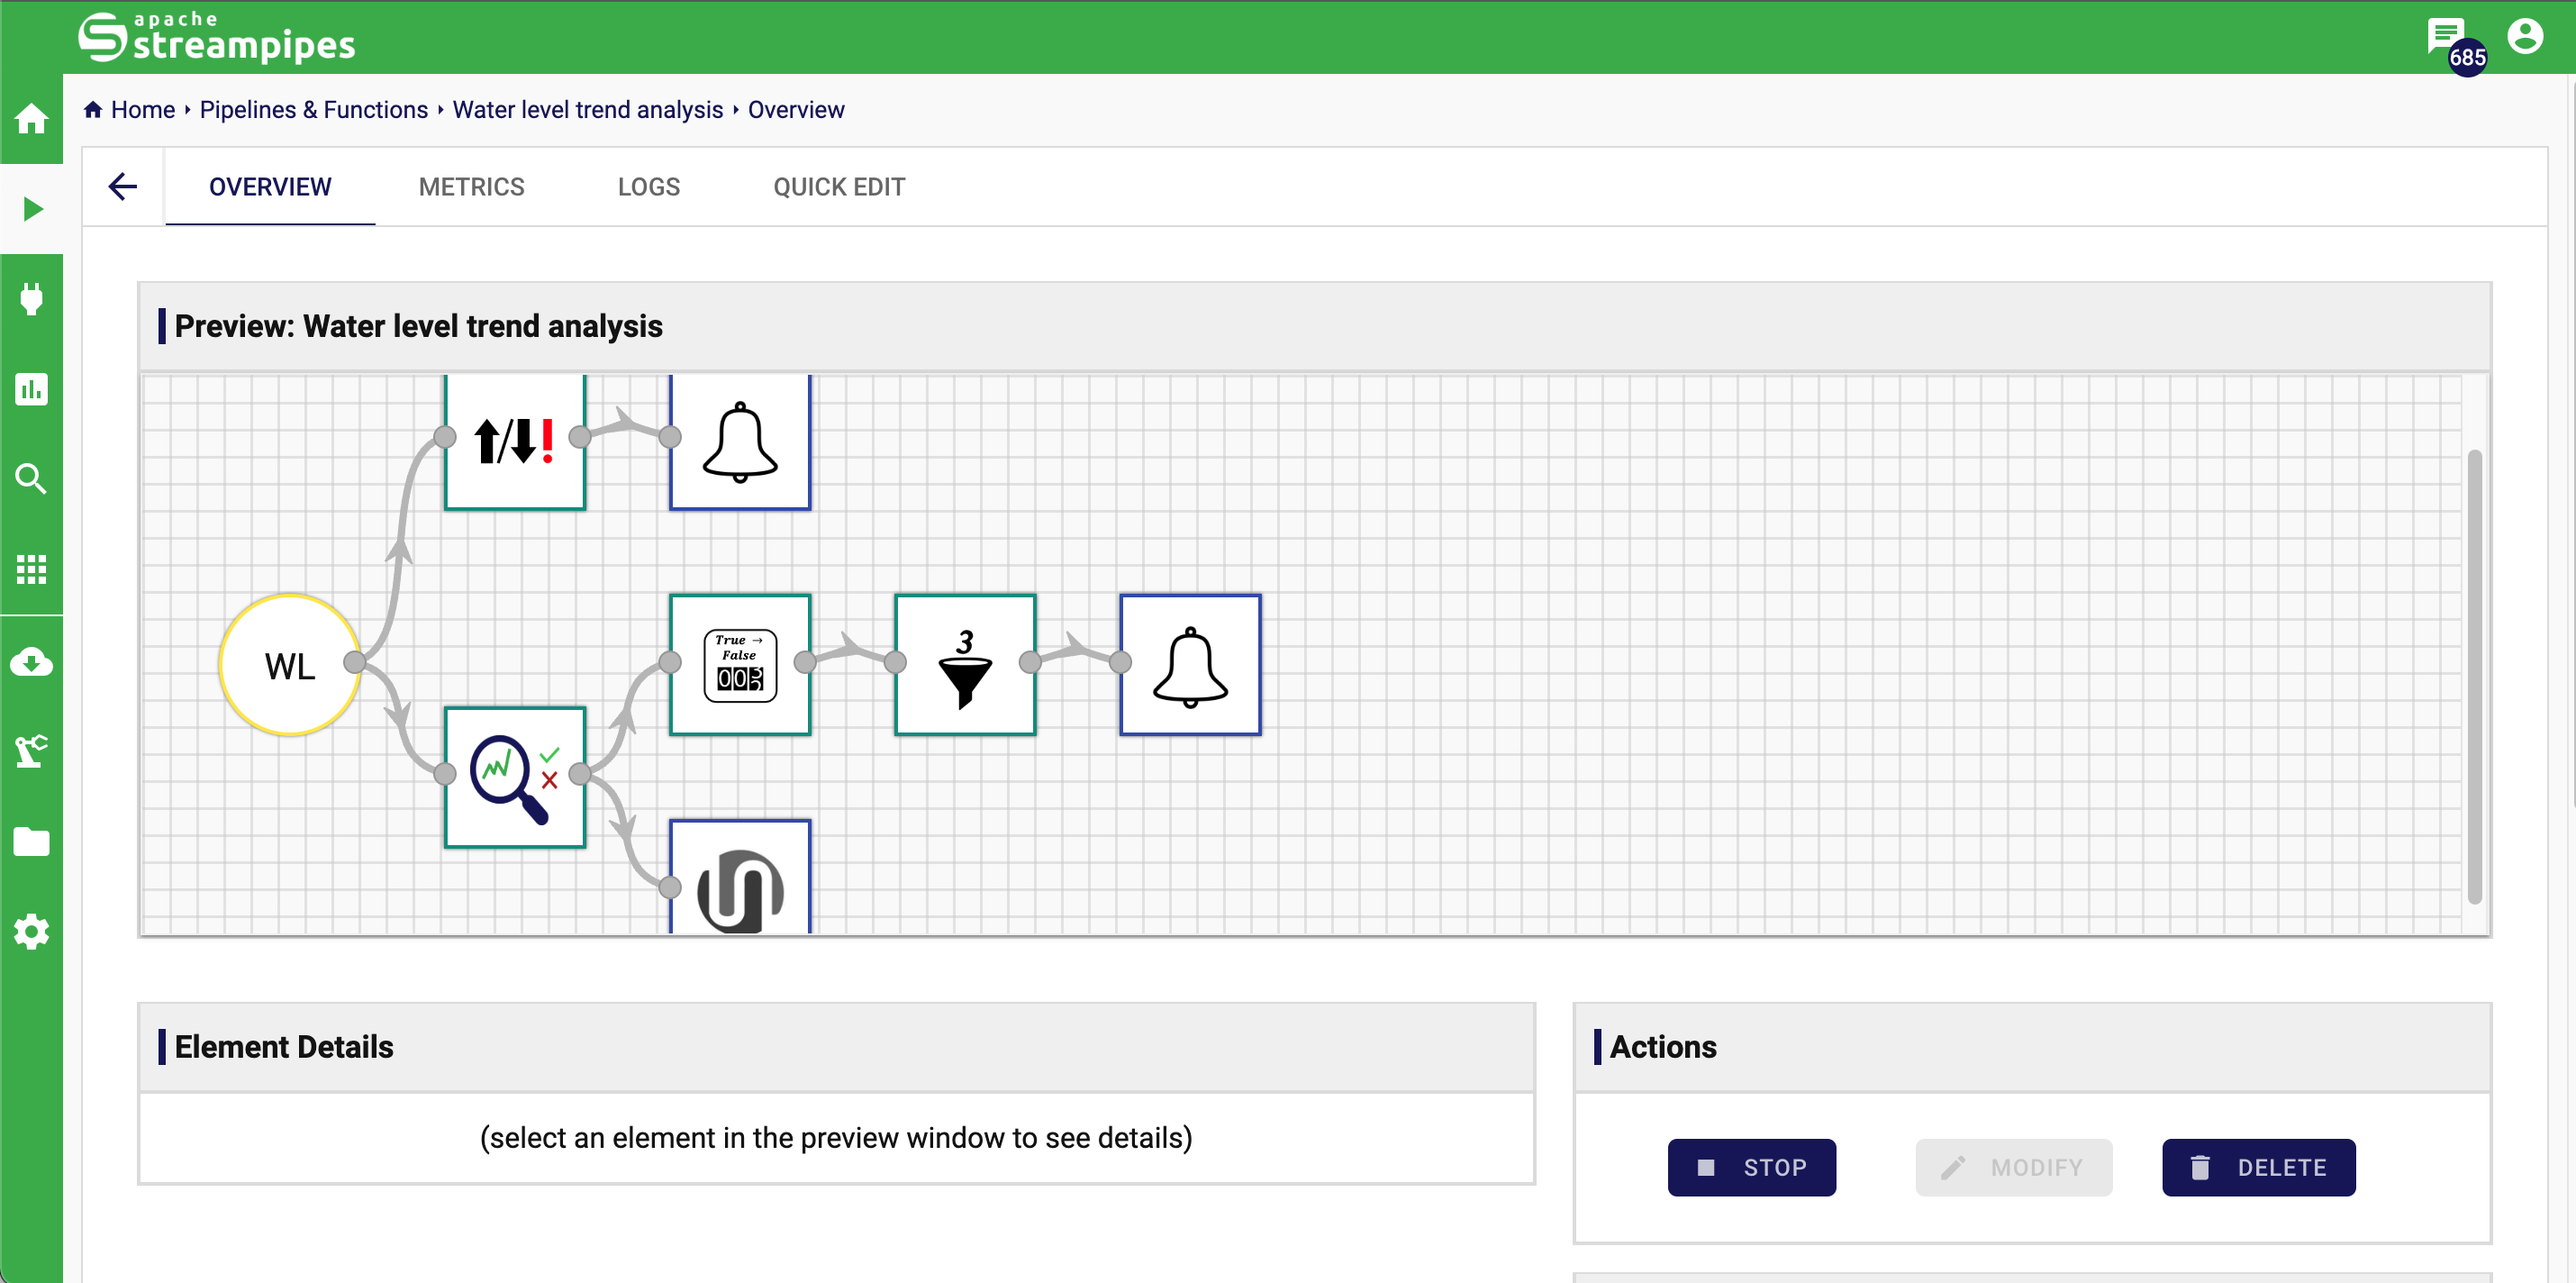
The pipeline contains 3 major parts:
- Data source:
- Machine Data Simulator (Water Level).
- Data Processors:
- Trend Detector: to analyse the water level increase speed within specified time, when Trend Detector find the speed is reaching the limit, it will trigger the notification.
- Welford Change Detection: to calculate the variance of the mean and change of the water level over a specified time
- Boolean Counter: to count each
overflowstatus change fromfalsetotrue. - Numerical Filter: when
overflowstatus change fromfalsetotruereaches 5 times, it will trigger Notification.
- Data Sinks:
- Notification: to push a notification when the measured parameter condition reaches the set condition of the trigger, which are sent to Notification interface.
- Data Lake: to store the events in the internal data lake, offering data for dashboard and data explorer.
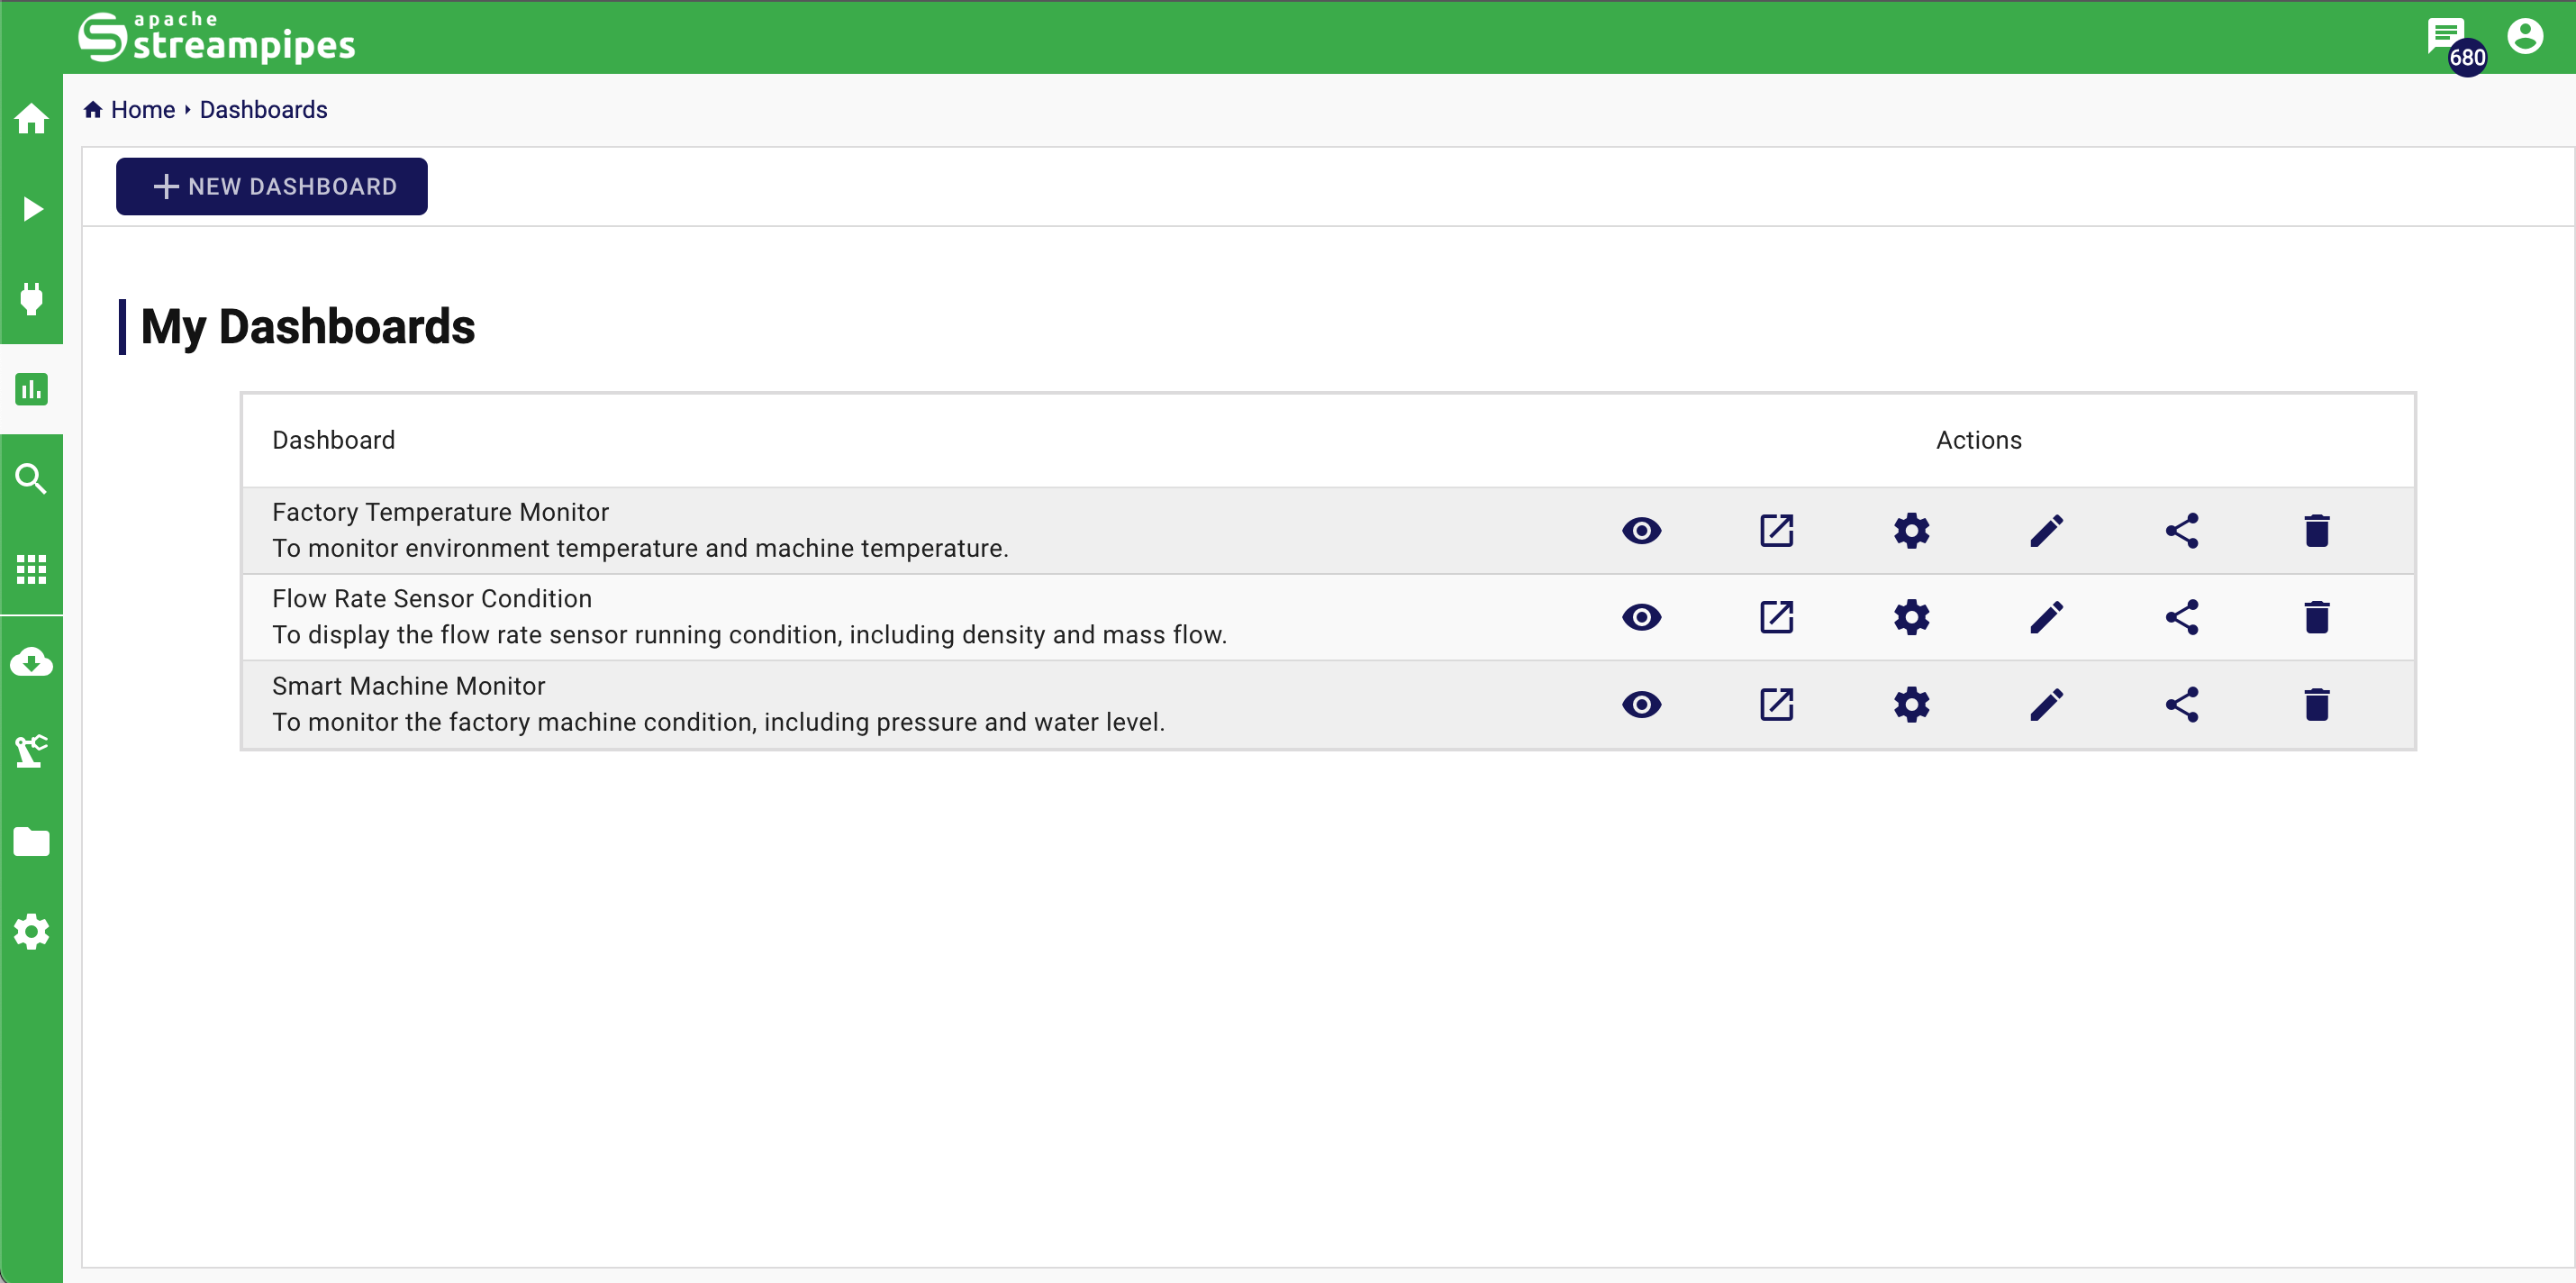
Dashboard
The Dashboard can be used for multiple use cases.
It is a good way to live monitor a running system in a dashboard, it also could be used during the pipeline development to get a fast feedback from newly created pipelines. Currently 10 different types of visualizations are available, including line charts, various map visualizations and data tables. The Dashboard feature allows you to select and view real-time data from specific pipelines that interest you.
In the Quickstart mode, we offer three distinct dashboards, each designed for a specific application scenario. These dashboards include factory temperature monitoring, sensor running condition monitoring, and real-time machine data monitoring.
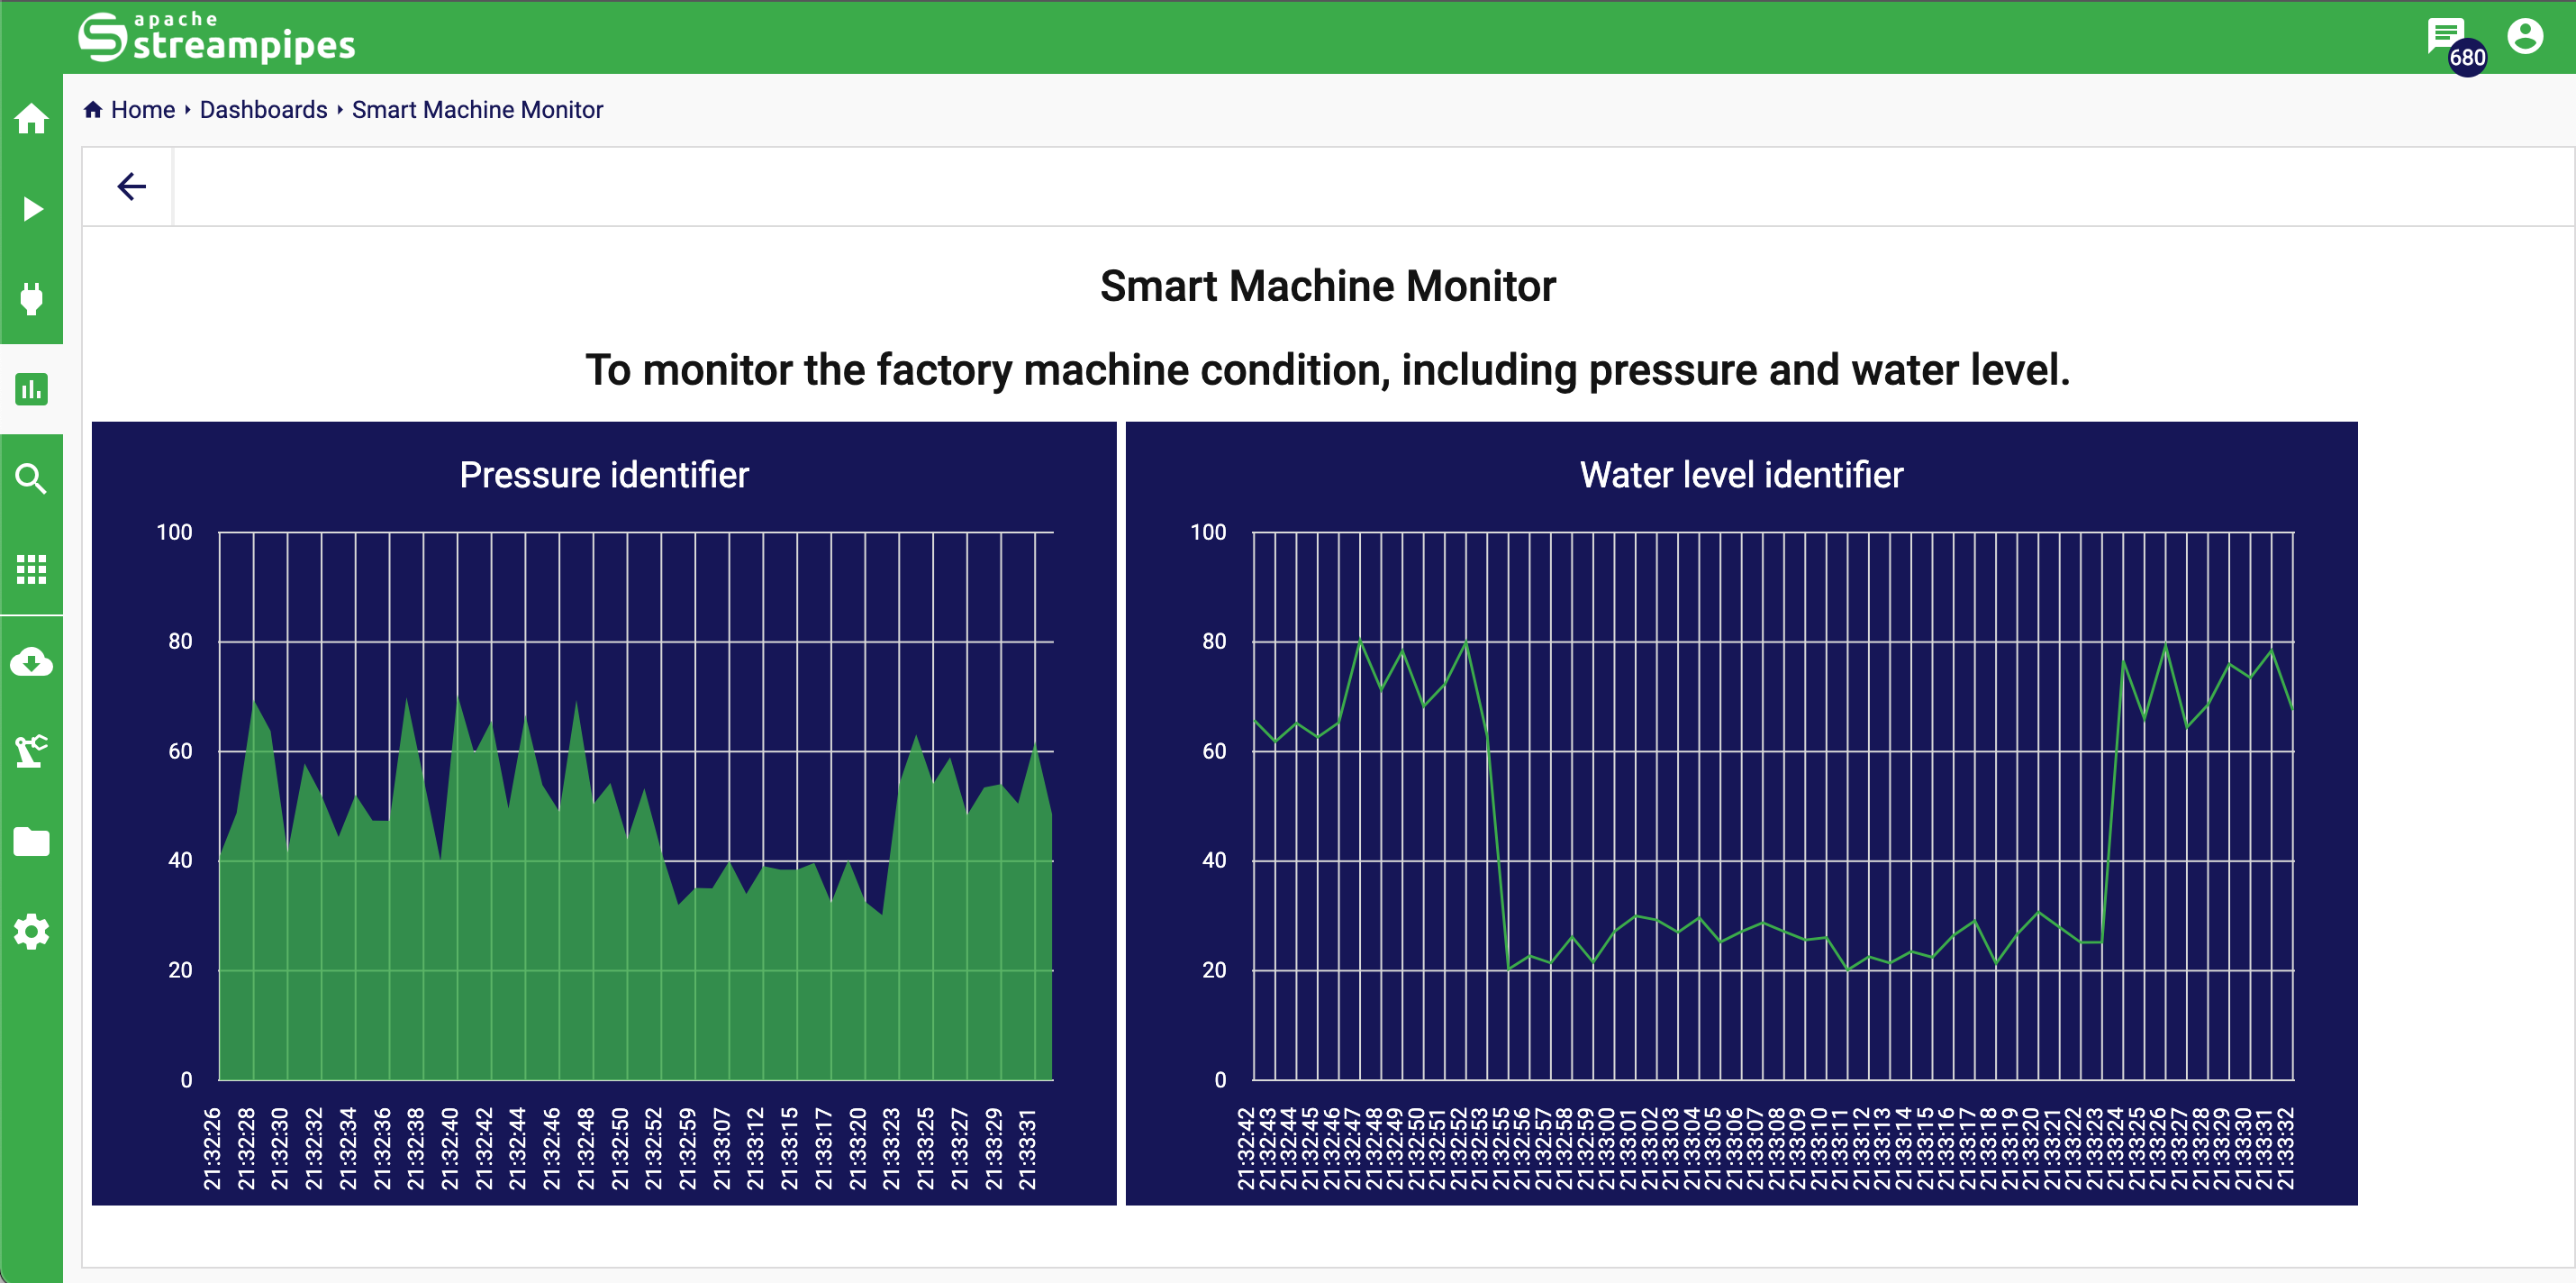
As shown in the following figure, taking the Smart Machine Monitor as an example, the dashboard can showcase real-time data for monitoring machine parameters such as pressure and water level.
Data Explorer
The Data Explorer can be used for visualizing and exploring data streams that have been persisted using the Data Lake sink.
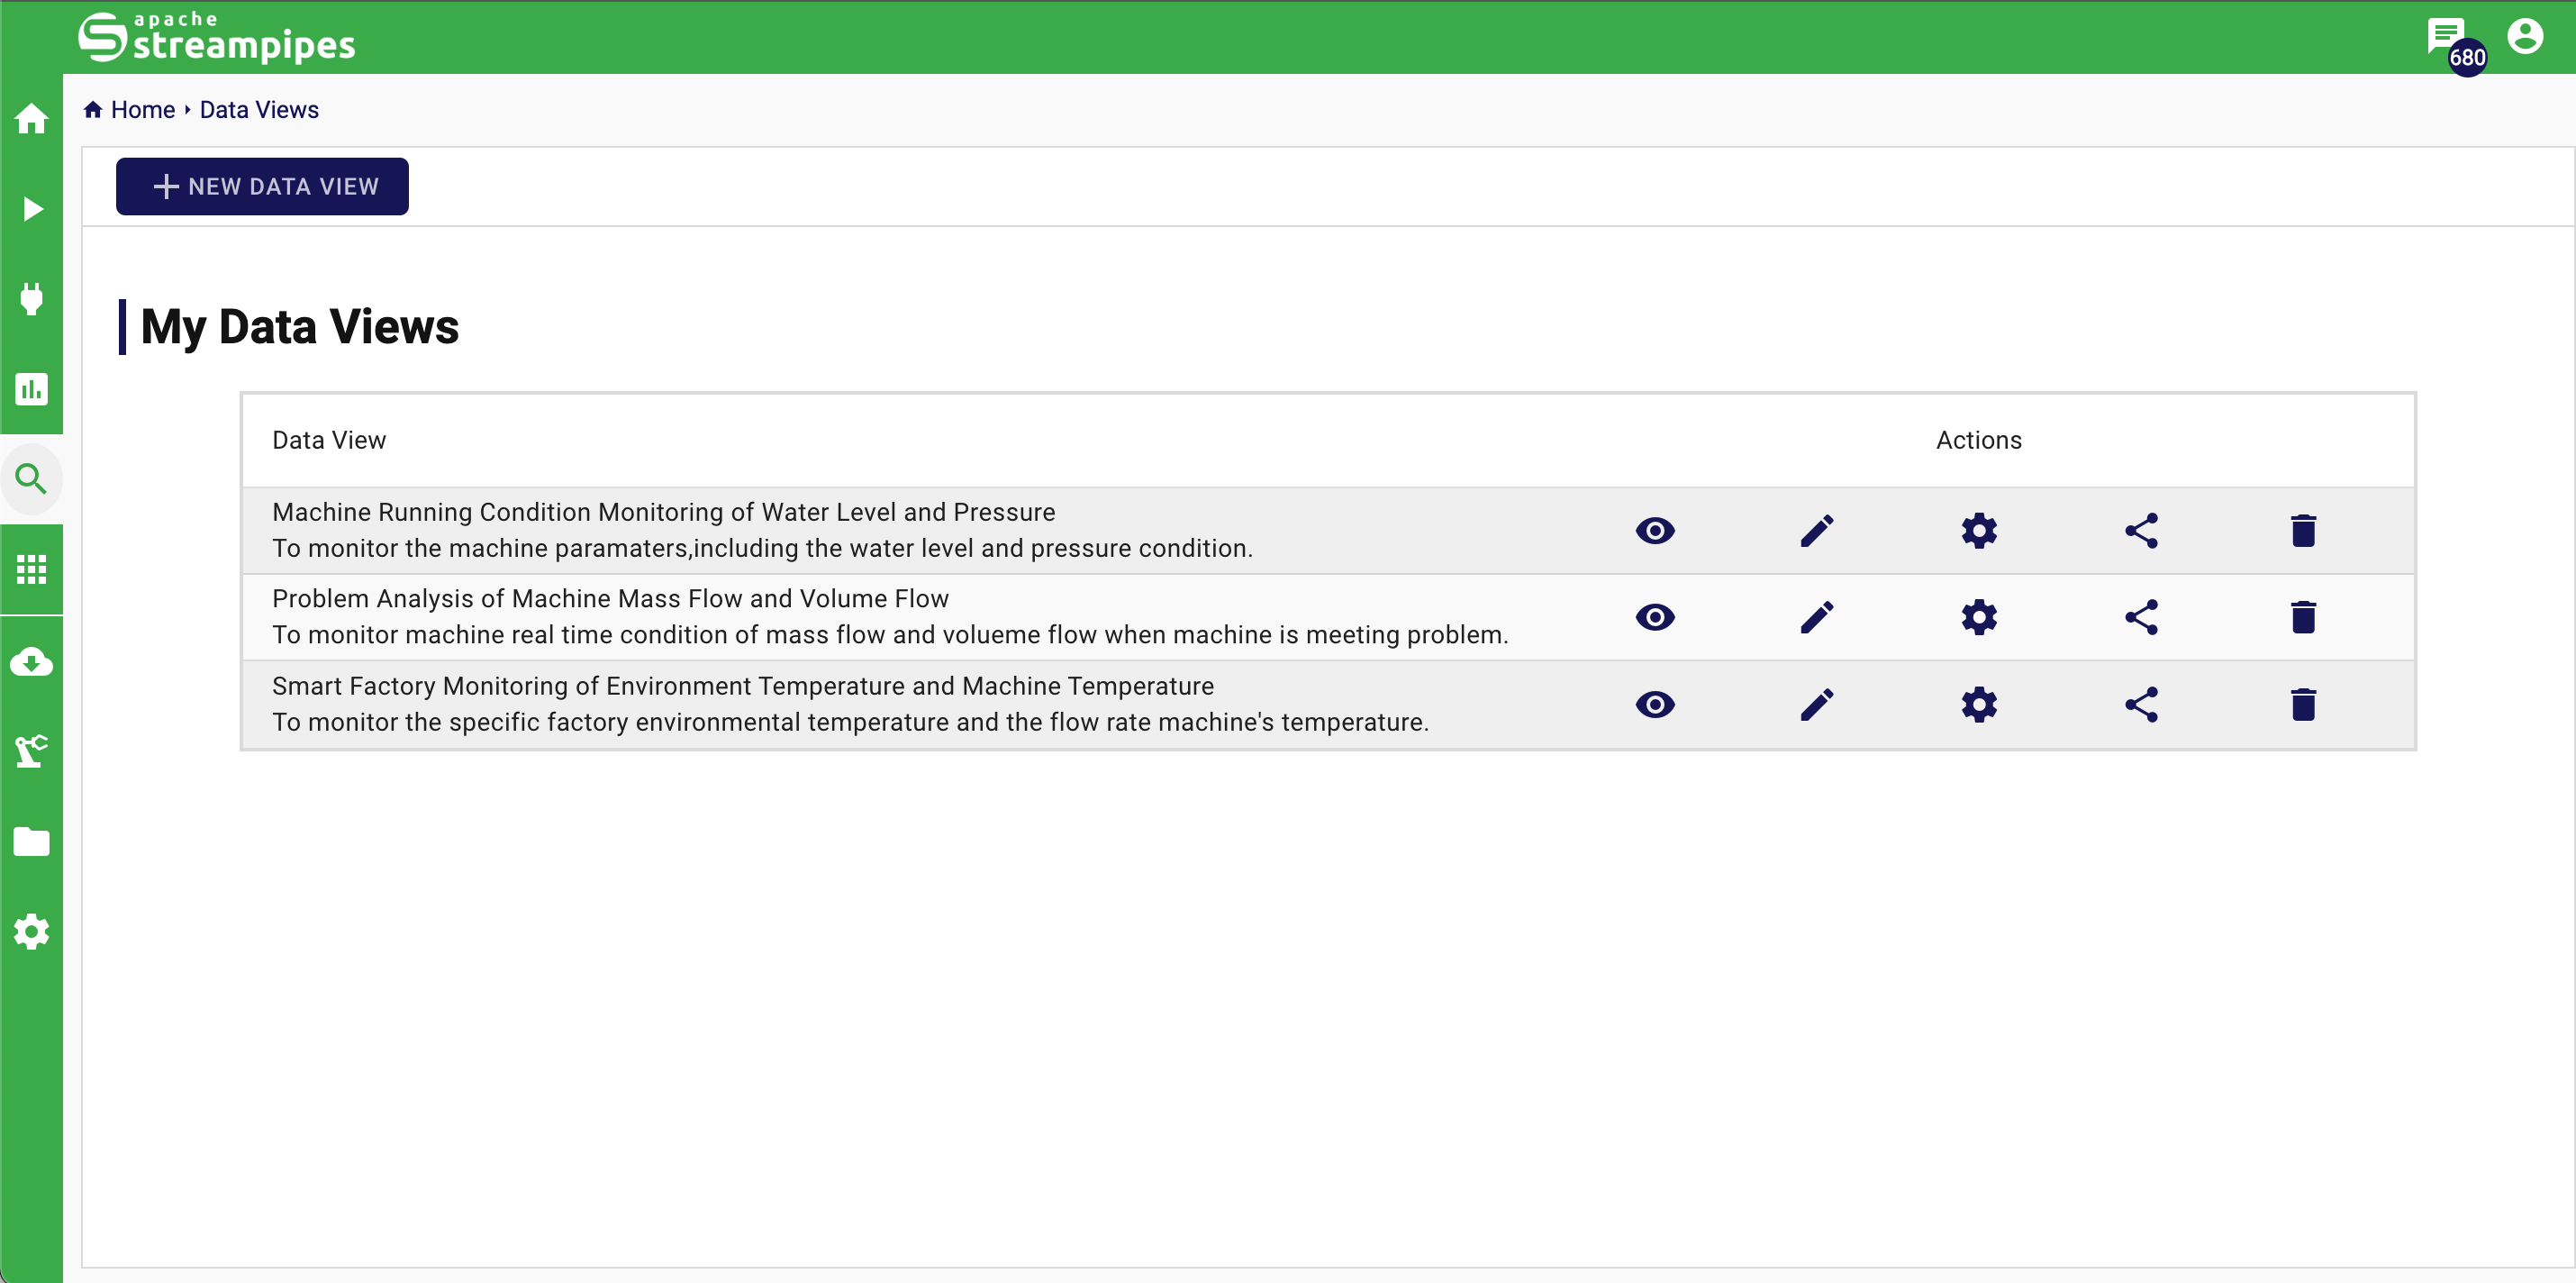
Once your data has been stored in the data lake, you can navigate to the data explorer tab to craft a new data view with the widgets of your preference. In StreamPipes, a data view is a compilation of related widgets, which can be data visualizations or plots, all assigned to a specific date and time range. By default, this range encompasses the last 15 minutes of the current date and time. However, you also have the flexibility to choose from predefined ranges, such as a day or a month, or to customize the exact date and time range that you wish to investigate.
In the Quickstart Mode, we try to demonstrate the StreamPipes' practicability and convenience in data analysis, by providing example data views for specific application scenarios, including machine running condition monitor, problem analysis, factory environment monitor.
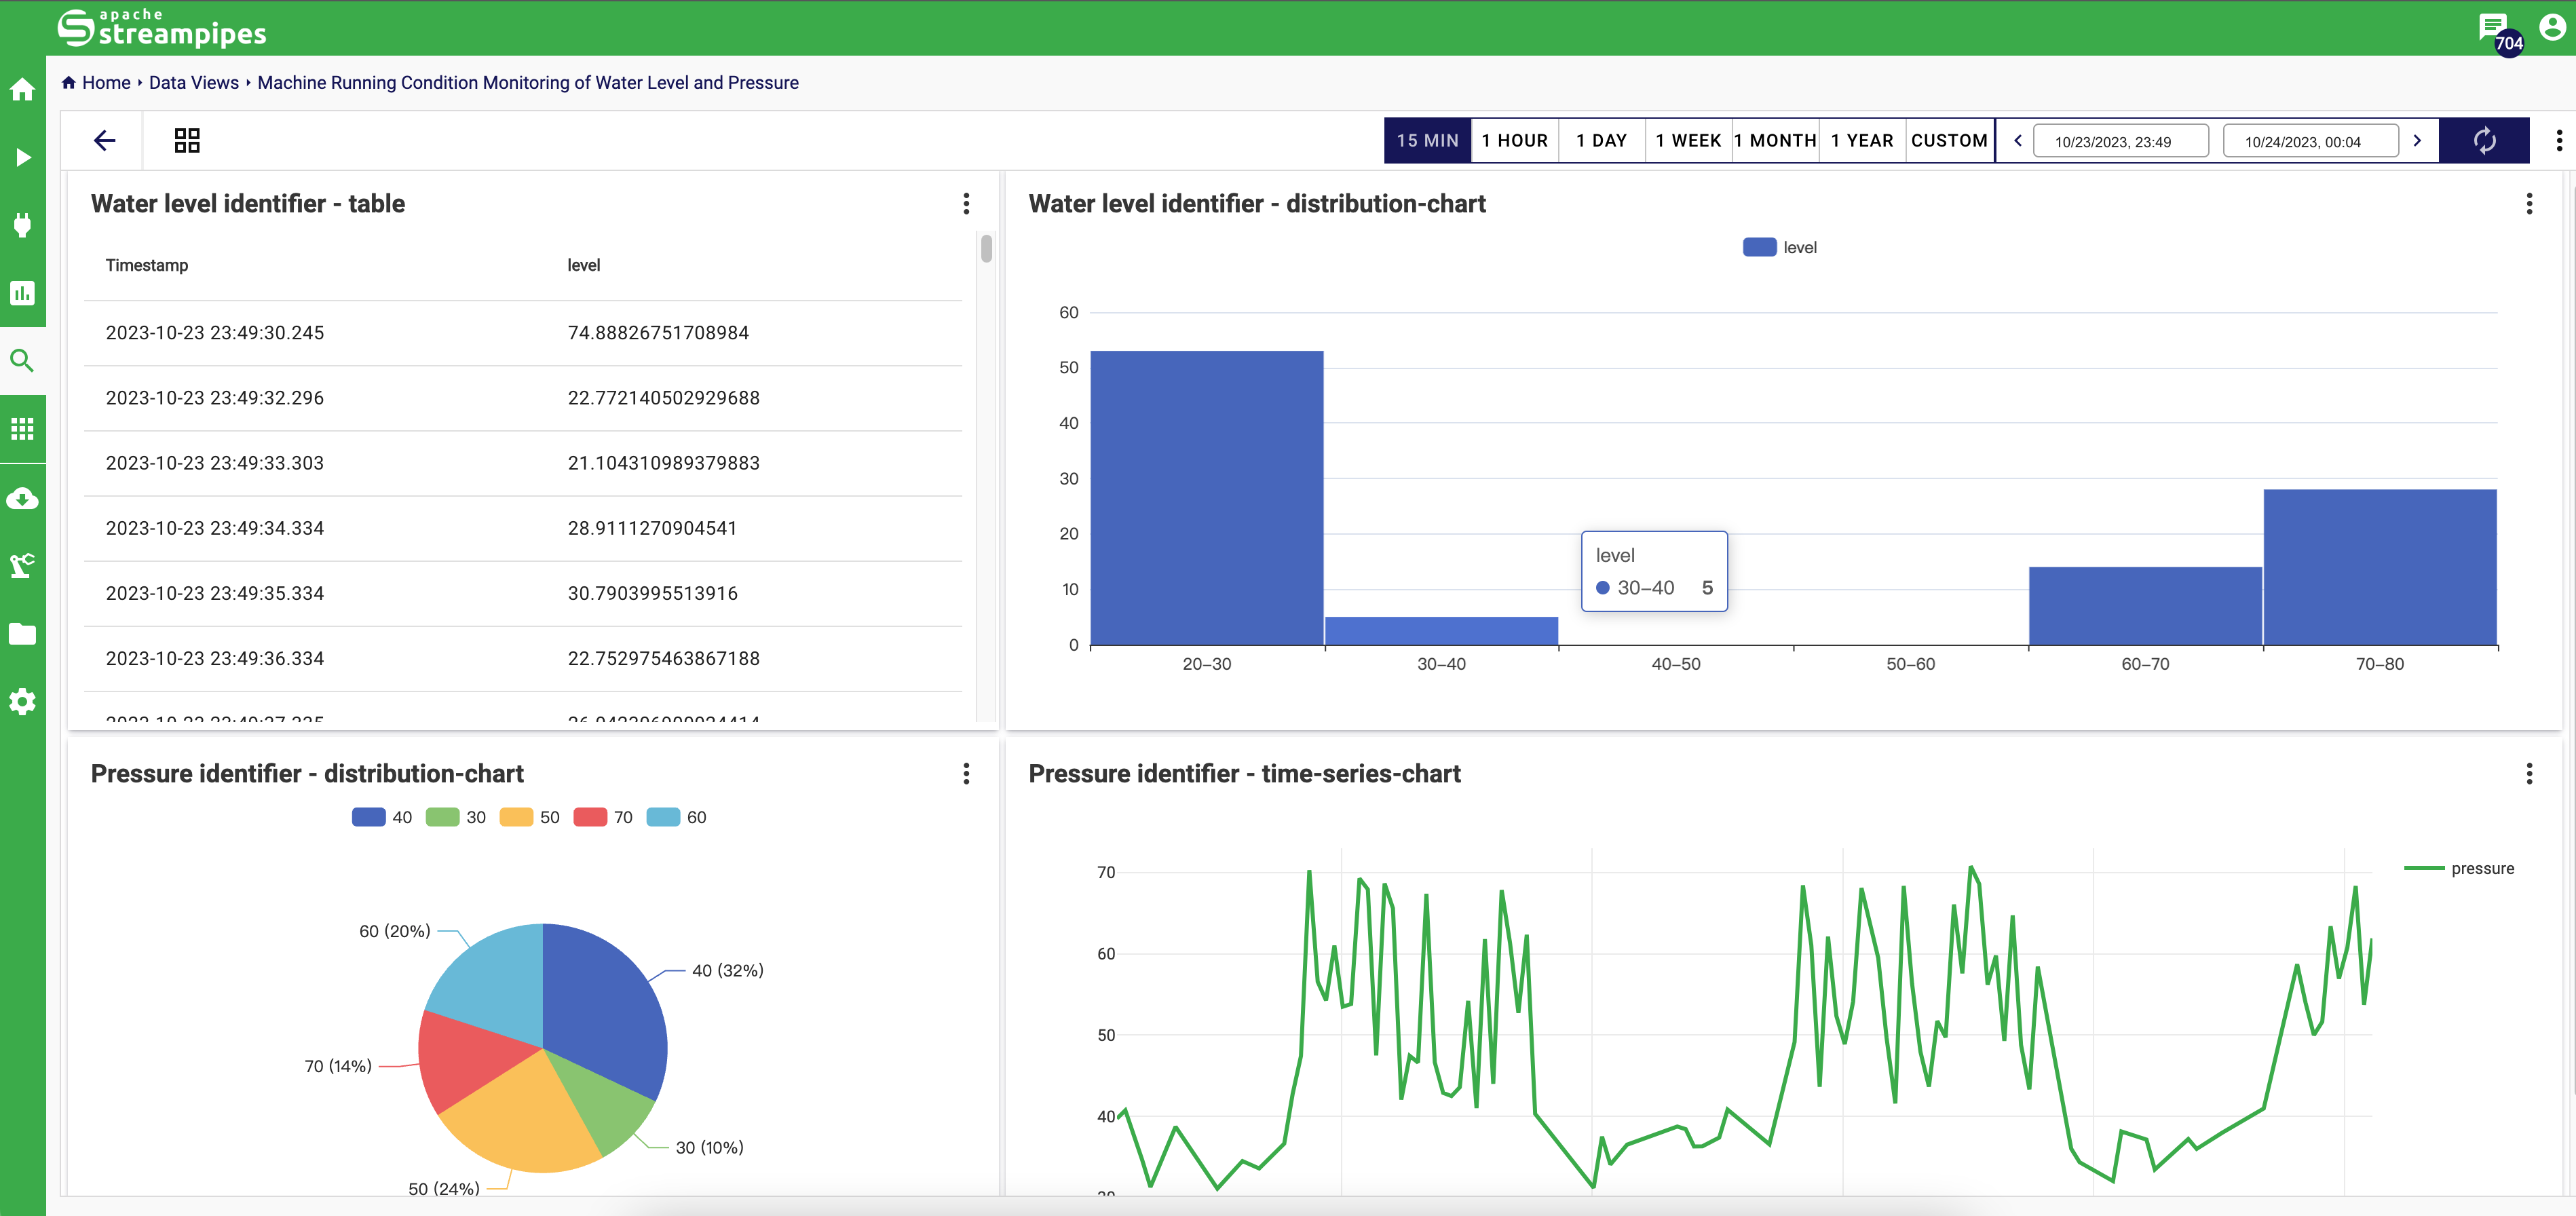
As shown in the following figure, taking the Machine Running Condition Monitoring of Water Level and Pressure data view as an example, the data explorer can show real-time machine data as different types of widgets, depending on what the user needs, to help analyse the data better.
In the machine running condition scenarios, we pay attention to the distribution of water level and pressure, as well as the pressure change condition.
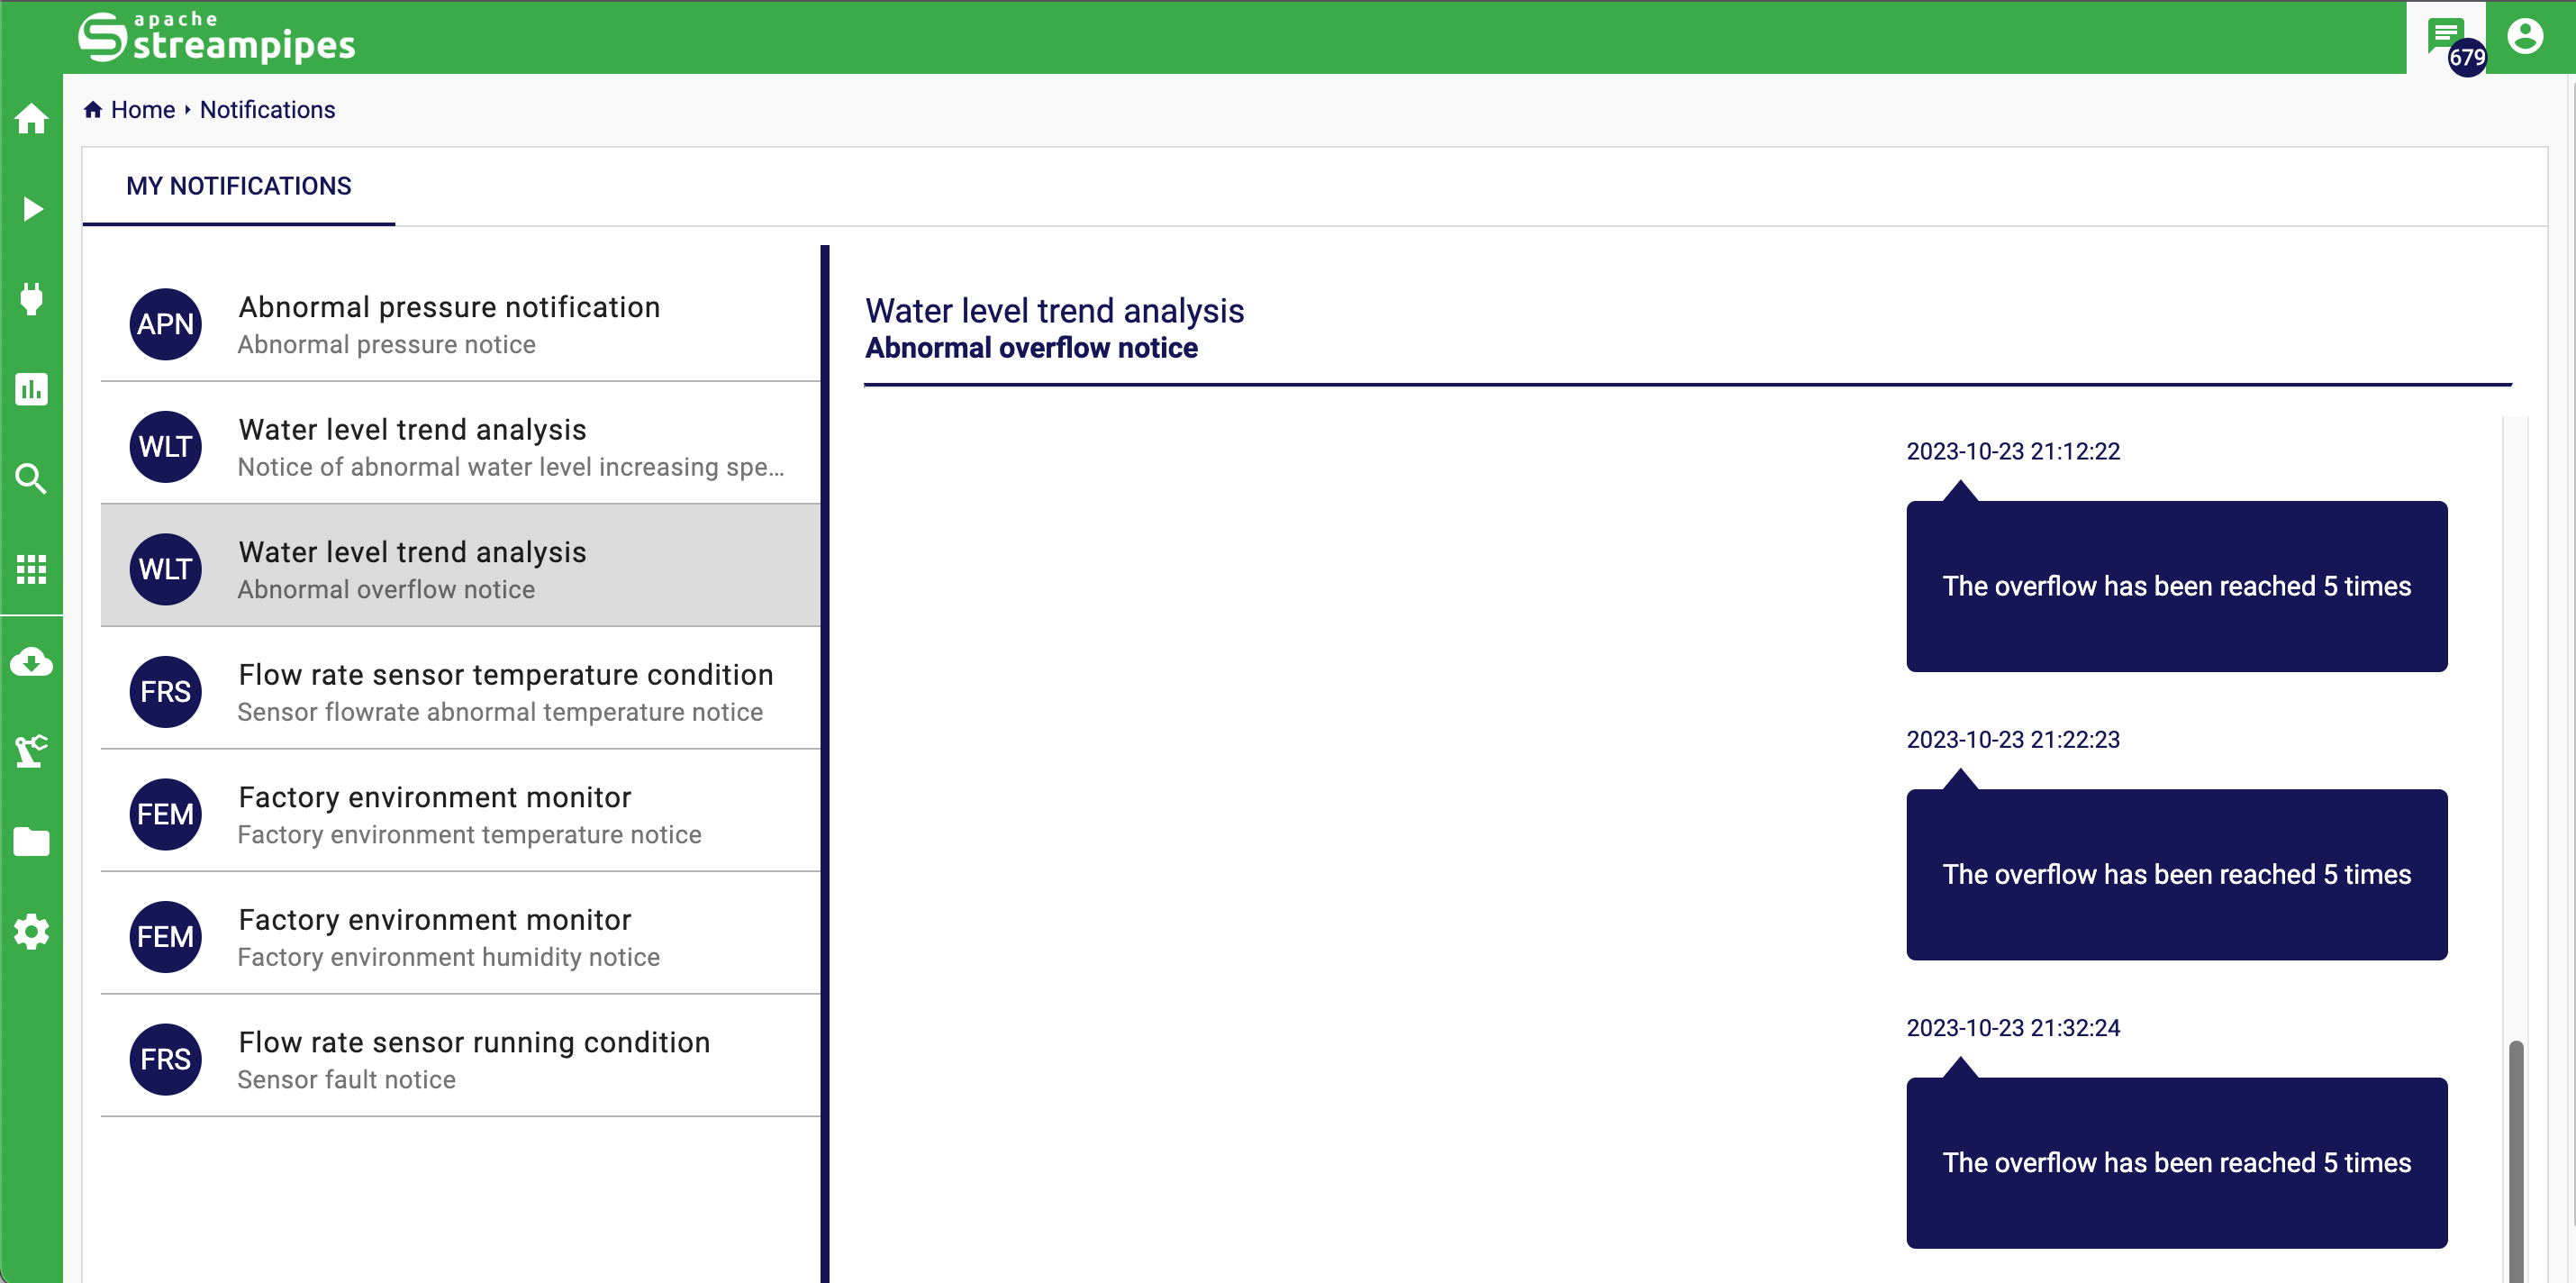
Notifications
The Notifications can be used for notifying someone when a urgent situation occurs.
A notification can be created by using the notification sink in the pipeline editor. The message can be nicely configured in the message editor. It is also possible to embed values of the event that triggered the notification. All available properties are presented in the notification configurator.
In Quickstart mode, StreamPipes have pre-defined several notification trigger in the example pipelines, when you click the Notification button in the upper right corner, you could see the notification dialog.
Congratulations! You've just finished Quickstart user guide of StreamPipes.